Want Your Page to Earn $30K+ a Month?
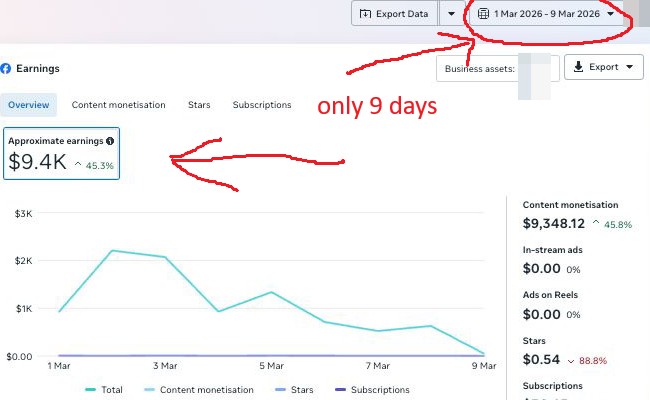
That screenshot is from one of our partner pages — $9,400 in just 9 days from Facebook Content Monetization. We work with page owners to set up, optimize, and scale their monetization. Drop your page URL below and we'll take a look.
Application Received — Here's What We Recommend
Your page doesn't currently qualify for the partnership. The good news: the path to monetization is well mapped, and you can start today.
Facebook Monetization Suite
Tools, automation, and strategy to grow your audience and unlock Facebook monetization.
Start Growing My Page →Facebook Elite Consulting
Personalized, hands-on guidance for established publishers who want to scale faster.
Get Expert Guidance →Once your page qualifies, you're welcome to re-apply for the partnership.
Facebook Ads ROI Calculator
Measure the true return on your Facebook ad spend. Calculate ROI, ROAS, profit margin, CPA, and CPM instantly — and find out whether your campaigns are actually making money.
What Is Facebook Ads ROI and How Is It Calculated?
ROI (Return on Investment) for Facebook Ads measures how much net profit you generate relative to what you spent on advertising and product costs. The formula is: ROI = (Net Profit / Total Cost) × 100. Net profit is your revenue minus both your ad spend and the cost of goods or fulfillment. A positive ROI means your campaign is profitable; a negative ROI means you are spending more than you are earning.
ROAS (Return on Ad Spend) is a related but different metric. ROAS only compares revenue to ad spend — it ignores product costs. The formula is: ROAS = Revenue / Ad Spend. A ROAS of 3x means you earned $3 for every $1 spent on ads. ROAS is useful for evaluating ad efficiency, but ROI is more important for understanding actual profitability. A campaign with a 4x ROAS might still be unprofitable if your product margins are thin.
For most e-commerce businesses, a ROAS of 3x to 5x is considered healthy, depending on margins. For lead generation campaigns where conversions happen offline, CPA (cost per acquisition) is often the primary metric. Knowing your target CPA — the maximum you can spend per customer and remain profitable — is the most important number for scaling Facebook ad campaigns.
Facebook Ads Benchmark Reference
These are approximate industry averages across Facebook ad campaigns as of 2024–2025. Your actual numbers will vary by industry, audience, and ad quality:
| Metric | Average | Good | Excellent |
|---|---|---|---|
| CTR (Click-Through Rate) | 0.9% | 1.5% – 3% | Above 3% |
| CPM (Cost per 1,000 Impressions) | $8 – $14 | $5 – $8 | Below $5 |
| CPC (Cost per Click) | $0.50 – $1.50 | Below $0.50 | Below $0.30 |
| Conversion Rate | 2% – 5% | 5% – 10% | Above 10% |
| ROAS (e-commerce) | 2x – 3x | 3x – 5x | Above 5x |
How to Improve Your Facebook Ads ROI
- Test Multiple Creatives: Run 3–5 ad variations per campaign and pause underperformers after a statistically meaningful sample. Even one strong creative can dramatically improve ROAS.
- Narrow Your Audience: Broad targeting wastes budget on people unlikely to convert. Use custom audiences from your email list or website visitors as a starting point.
- Improve Your Landing Page: A high-converting landing page is often worth more than any ad optimization. If your CTR is good but conversion rate is low, the problem is post-click.
- Use Retargeting Campaigns: Retargeting website visitors and cart abandoners typically yields 3–5x better ROAS than cold traffic. Keep your retargeting audiences warm.
- Set a Target CPA and Bid Accordingly: Use Facebook's cost cap or bid cap to prevent overspending per conversion. Know your break-even CPA and keep your actual CPA well below it.